Manufacturing Root Cause Analysis for Data Scientists with Causal AI
Technical Demo
From raw data of a complex production line to understanding the root causes of faults
Summary; Root Cause Analysis
Optimzing the overall equipment effectiveness (OEE) levels within plants is key to overcome the challenging economics of manufacturing. To do this, fast root cause analysis of faults is required (whether in the line equipment or the end product). This is a great problem for AI to address, but traditional AI approaches often fail to deliver great results
Correlational AI approaches often fail to make an impact in manufacturing optimization
- they are unable to understand cause and effect within the data and so identifying the root cause of faults is a significant challenge
- they lack explainability & trust from domain experts who are expected to rely on them to make significant decisions
decisionOS by causaLens empowers data scientists to create decision workflows for identifying the root cause of manufacturing faults to optimize uptime
- Quickly identify the root cause of faults and report them to operators so that they can be actioned
- Clearly explain the root cause of the fault through causal graphs and structural causal models
Introduction
The economics of manufacturing are challenging and so maximizing overall equipment effectiveness (OEE) is key to ensuring a healthy, profitable operation. Machine availability and end product quality are two key factors which affect OEE. For this reason, it is imperative that manufacturing plants are able to minimize downtime while keeping product quality very high.
Of course, things do go wrong in operations which run for 24 hrs a day for the majority of weeks within a year. When they do, it is extremely important that the root cause of issues can be quickly understood and the underlying issues rectified. Artificial Intelligence (AI) is a key technology which can help with this. However, there are some challenges with using traditional AI techniques to identify the root causes of availability and quality issues. This article explains why traditional AI techniques struggle with this use case and why Causal AI is uniquely placed to overcome these challenges. It will also cover how decisionOS by causaLens allows manufacturing RCA solutions, based on Causal AI, to be built quickly and seamlessly.
Why not traditional AI techniques?
This type of problem is inherently challenging to address with traditional AI or machine learning techniques. The main reason for this is these techniques do not have a cause and effect understanding of the data. As such, they are limited to spotting statistical associations or patterns within historical data and then extrapolating from these to new problems as they arise. Whilst these patterns may give some indication as to the cause of an issue, fundamentally they are based on correlations within the data, and as such things which appear to be ’causes’ could instead simply be symptoms of a different cause. Causal AI allows the causes to be separated from the symptoms.
Furthermore, ML systems which are correlational in nature do not tend to generalize very well to out-of-sample data. This means that if a problem occurs which the model has not previously seen, it will attempt to use the patterns learnt in the data to diagnose the problem leading to incorrect results.
This article will demonstrate how Causal AI can be used to identify the root causes of issues in end product quality and how an understanding of these root causes can be used to prevent future faults. It will also show how this can be done seamlessly using decisionOS by causaLens, which provides access to all of the tools required for Root Cause Analysis based on Causal AI.
Manufacturing RCA
Figure 1 shows the distinct processes involved in an example manufacturing production line. The process starts with raw materials and then goes through a number of processes (A-H) and a quality check before the final product is complete. During process H, final measurements are taken and used for Quality Control. This allows a Quality Check score to be created which can be used to determine if the manufactured part is faulty.
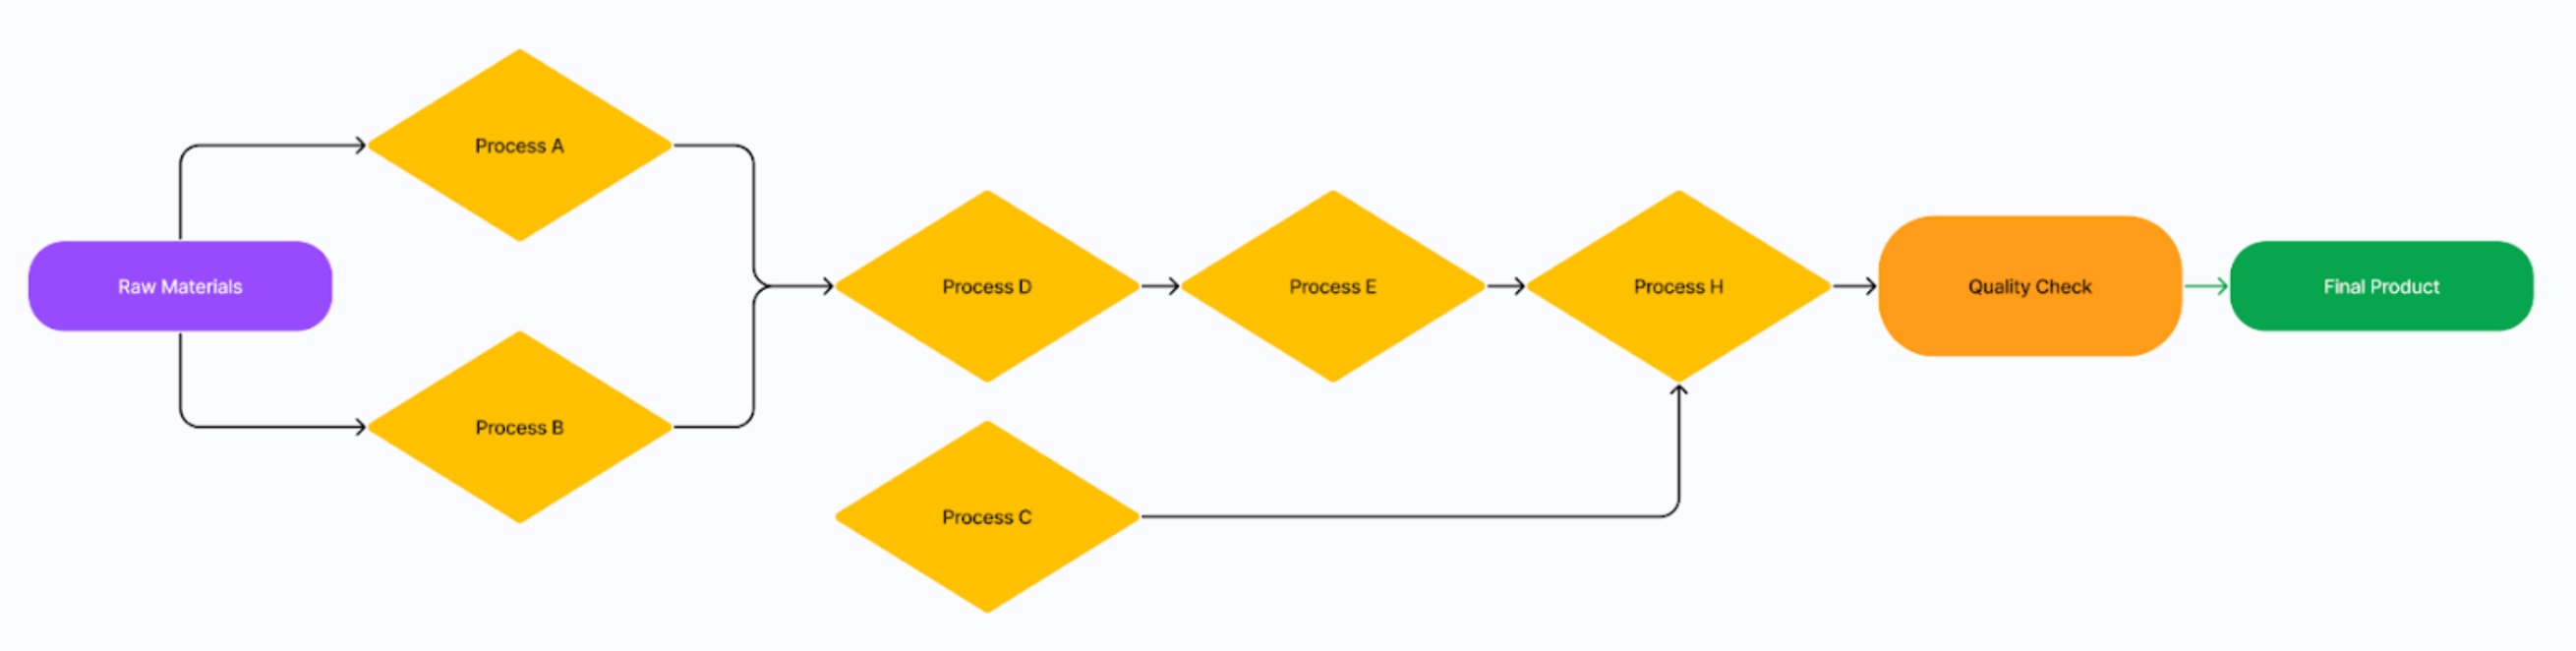
Figure 1: Production line high-level structure
When a part is identified as faulty, it is important to understand the root cause of the fault. Correlation-based ML may be able to identify possible causes, but is unable to isolate the root causes as fundamentally it struggles to understand the cause and effect dynamics within the system. This challenge is exacerbated by the fact that some of these processes occur in parallel and so the temporal component cannot always be used to help with the analysis.
A good way to overcome this is to use Causal AI to understand the true cause and effect relationships within the data and then trace back through these to find true root causes. A number of steps are required to do this:
- Human-Guided Causal Discovery: Use a combination of domain knowledge and Causal Discovery algorithms, to uncover the causal relationships within the data
- Causal Modeling: Understand the functional relationships between each of the nodes within the dataset, where a causal relationship exists
- Root cause analysis decision intelligence: Run Interventional and Counterfactual analysis to identify the root causes of issues and attribute their causal impact on the final product.
- Process optimization: Use the model results to understand the cause of faults in real-time, quickly resolving faults as and when they occur
The remainder of this article outlines the Causal modeling process for RCA at a technical level.
Creating Root Cause Analysis solutions for Manufacturing
with decisionOS by causaLens
The Causal data science workflow contains the following steps. These all need to be carried out by the data scientist in order to create a root cause analysis solution for manufacturing.
- Data Setup
- Load data from file store
- Anomaly Detection
- Causal Model Specification
- Define causal domain knowledge
- Discover a causal graph
- Train a structural causal model using causaLens’ proprietary CausalNet framework
- Root-Cause Analysis (RCA)
- Identify Root Causes
- Visualize top root-cause paths
Data Setup
Data can be loaded from any data storage location. In this instance, a static CSV file is being used, but decisionOS contains connectors for a range of common file stores and databases. Figure 2 shows the data being read-in and formatted.
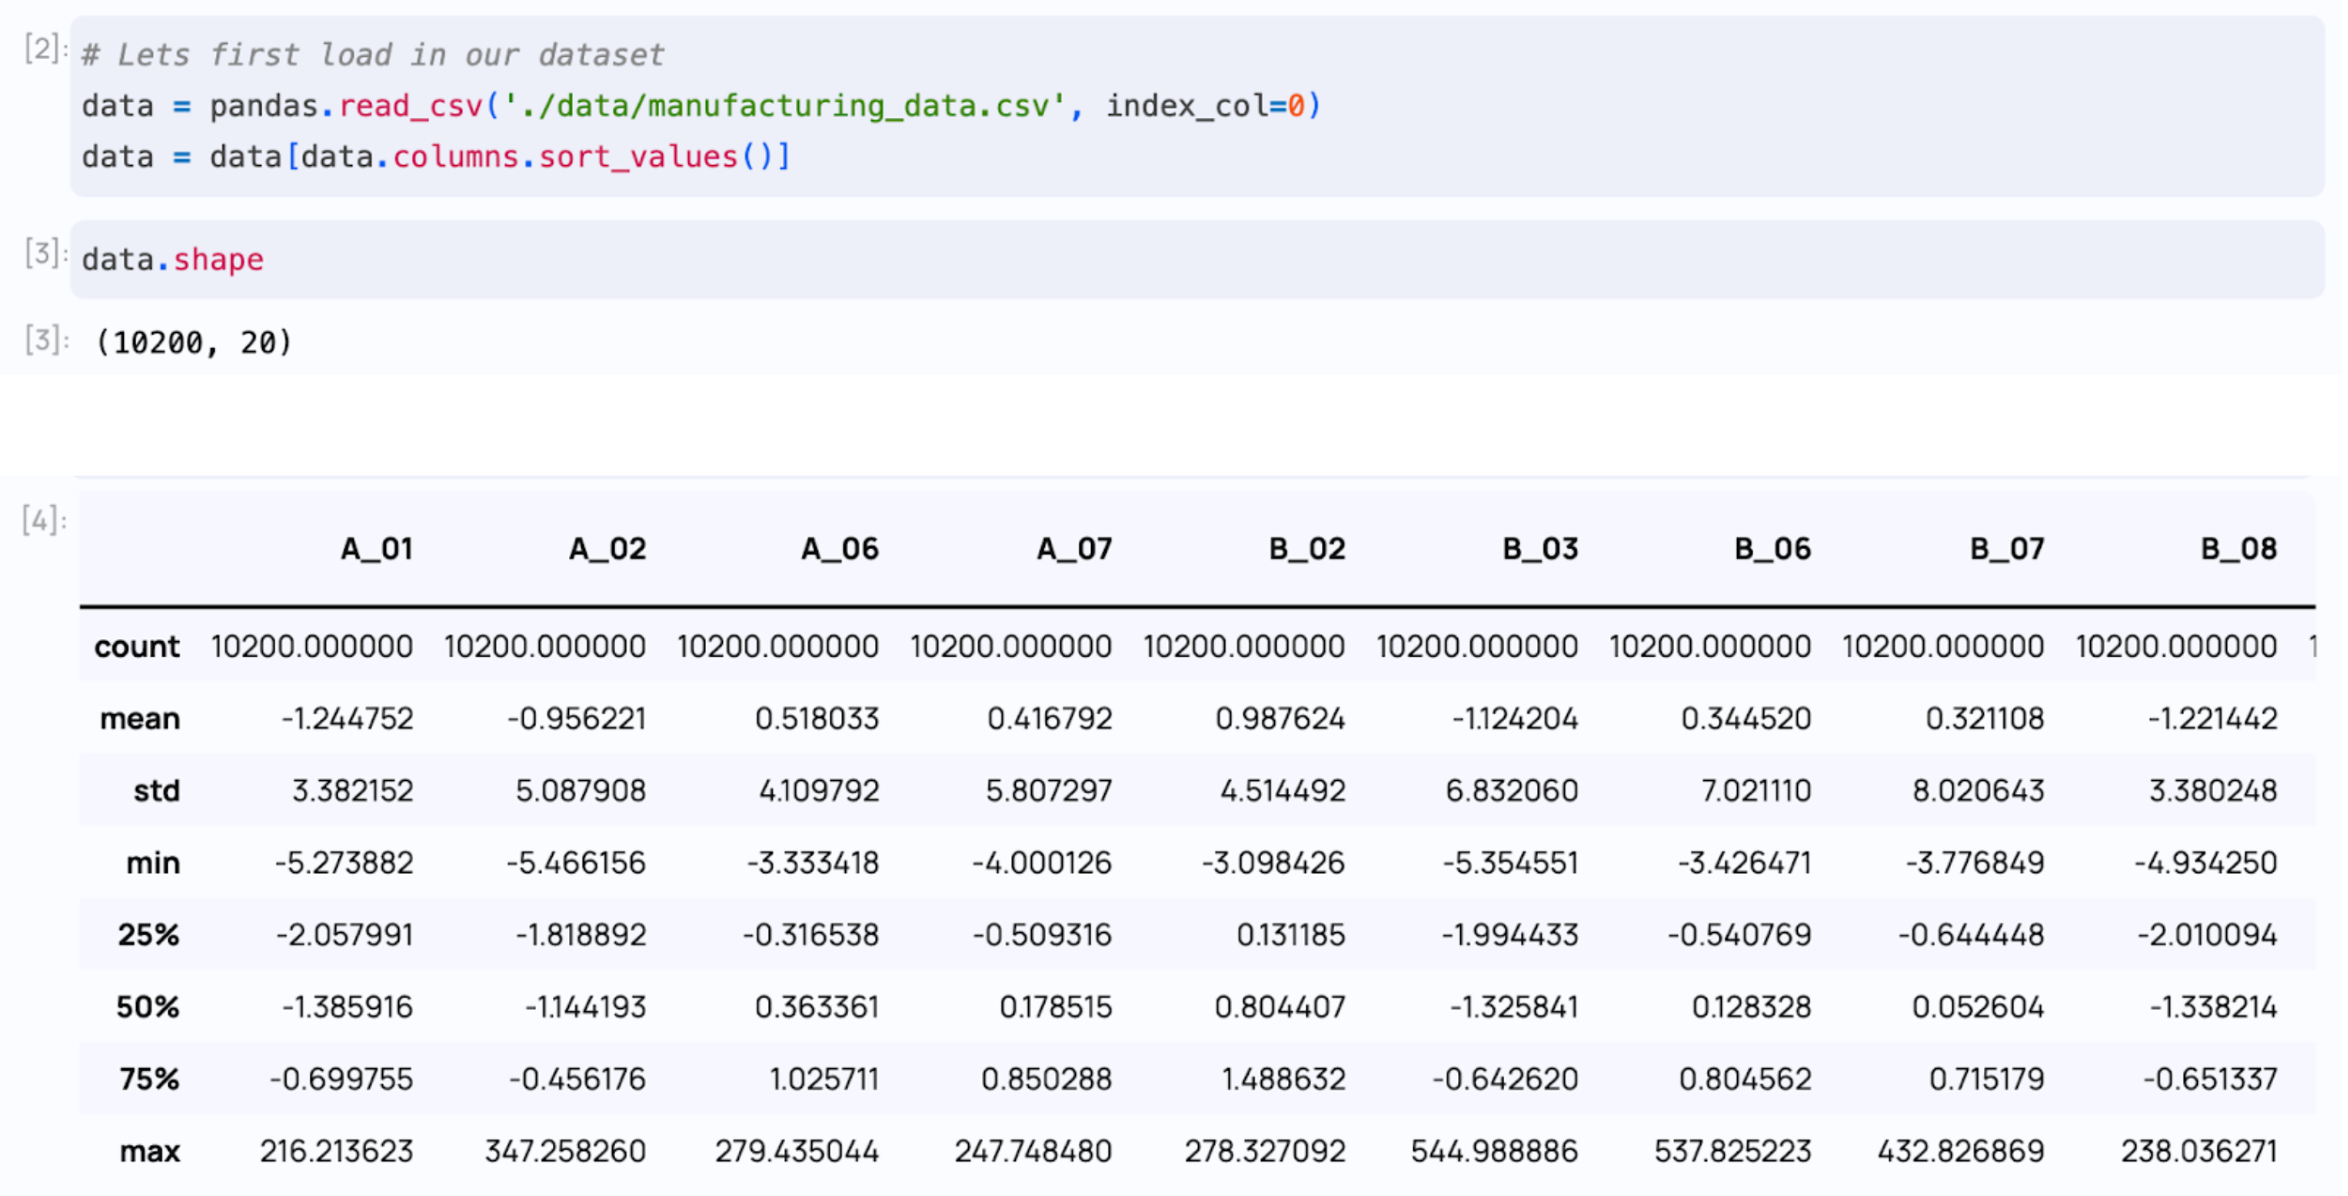
Figure 2: Data reading and formatting
Once the data has been loaded, a correlation matrix can be used to view block or process groupings. The Matplotlib library can easily be called from decisionOS to render the correlation matrix. See Figure 3. This provides an initial indication of where there are relationships which need to be further investigated.
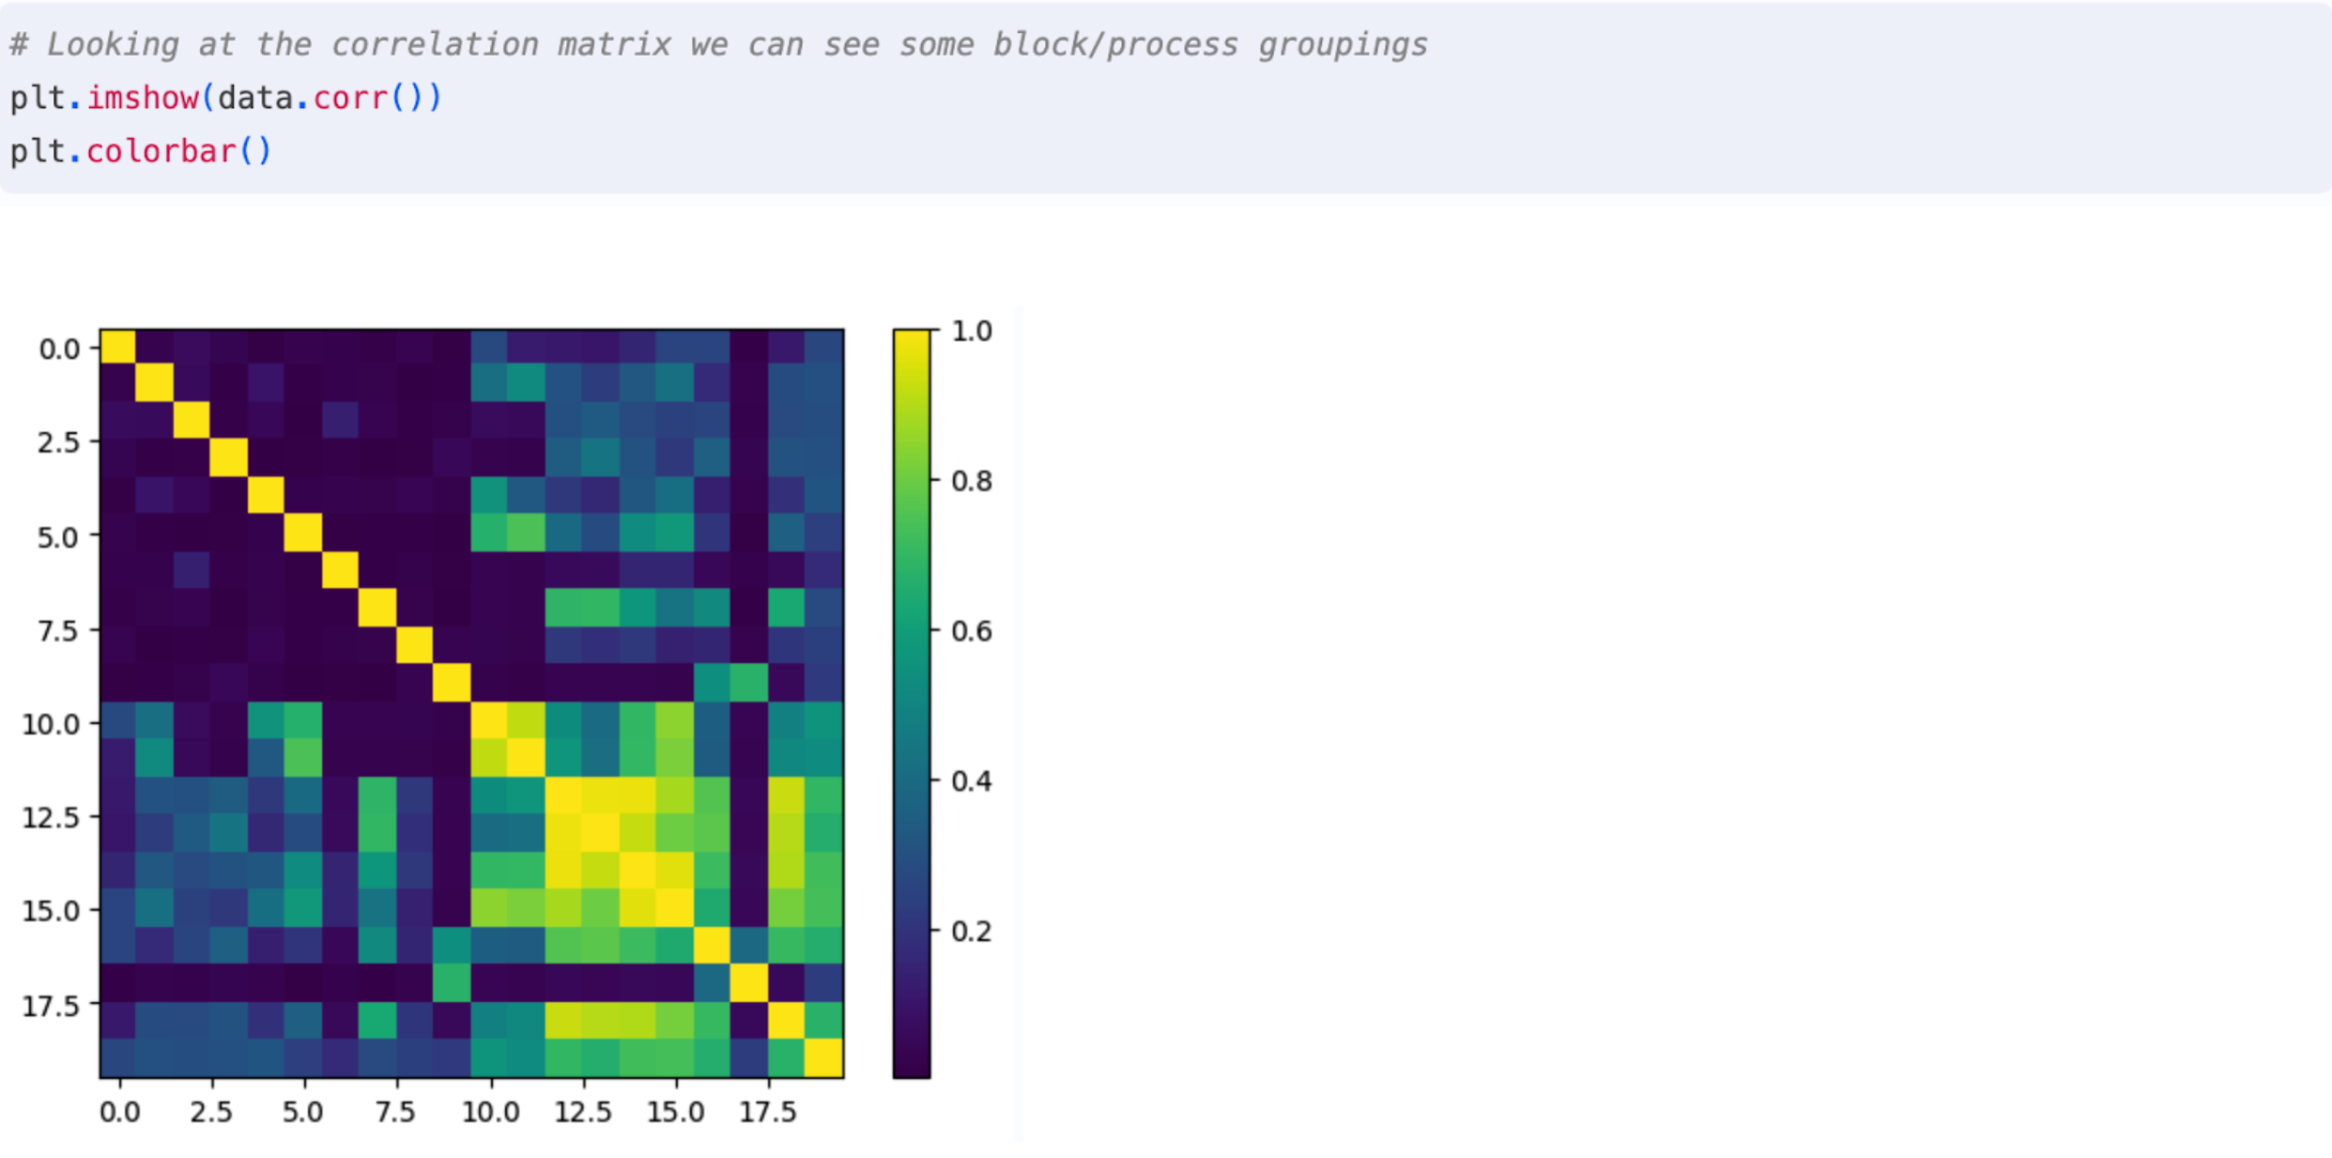
Figure 3: Correlation matrix between features
Anomaly detection
The next step is to explore anomalies (faults) within the dataset so that it is clear where root causes need to be identified. This check is based on the measurements taken in process H and marks a component as Faulty (1) or Acceptable (0). The measurements in H create a Quality Check score bounded between 0 and 1, if the score is >0.3 the item is marked as Faulty.
The data shows that there are faults in around 2% of cases (see Figure 4) for which root causes need to be identified.
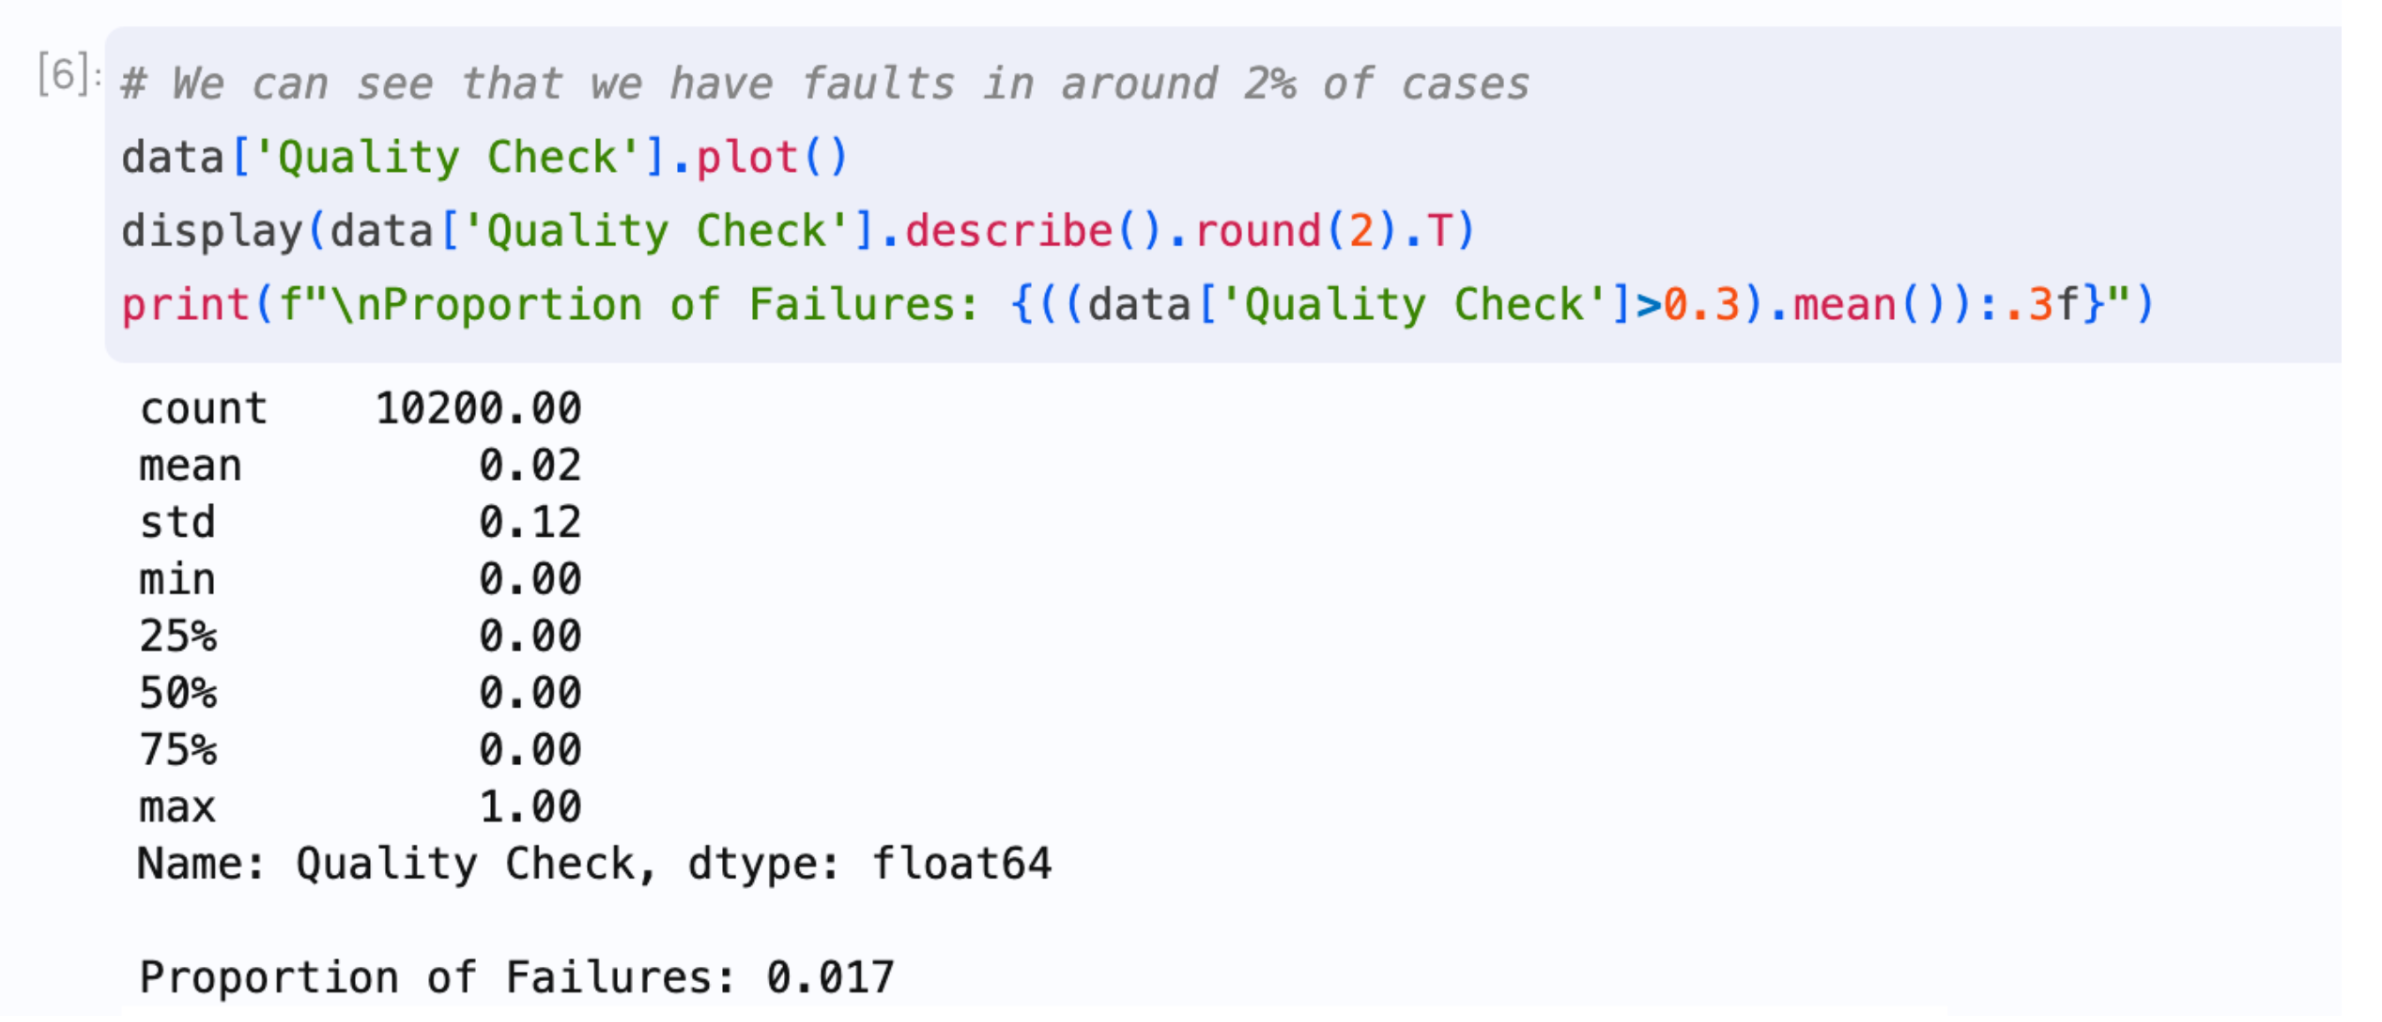
Figure 4: Identified faults within the dataset
Causal model specification
The first step of Causal model specification is Human-Guided Causal Discovery. This step involves discovering the cause and effect relationships within the manufacturing line. Human-Guided Causal Discovery involves a combination of inputs from domain experts as well as algorithmic methods to uncover cause and effect. This process is particularly effective within a manufacturing environment as large parts of manufacturing lines operate in a sequential manner and as such there is a clear causal ordering to the system.
Knowledge of the physical system can be encoded by grouping variables into tiers, corresponding to each process, and then ordering these tiers in a causal hierarchy. This process is outlined in Figure 5.
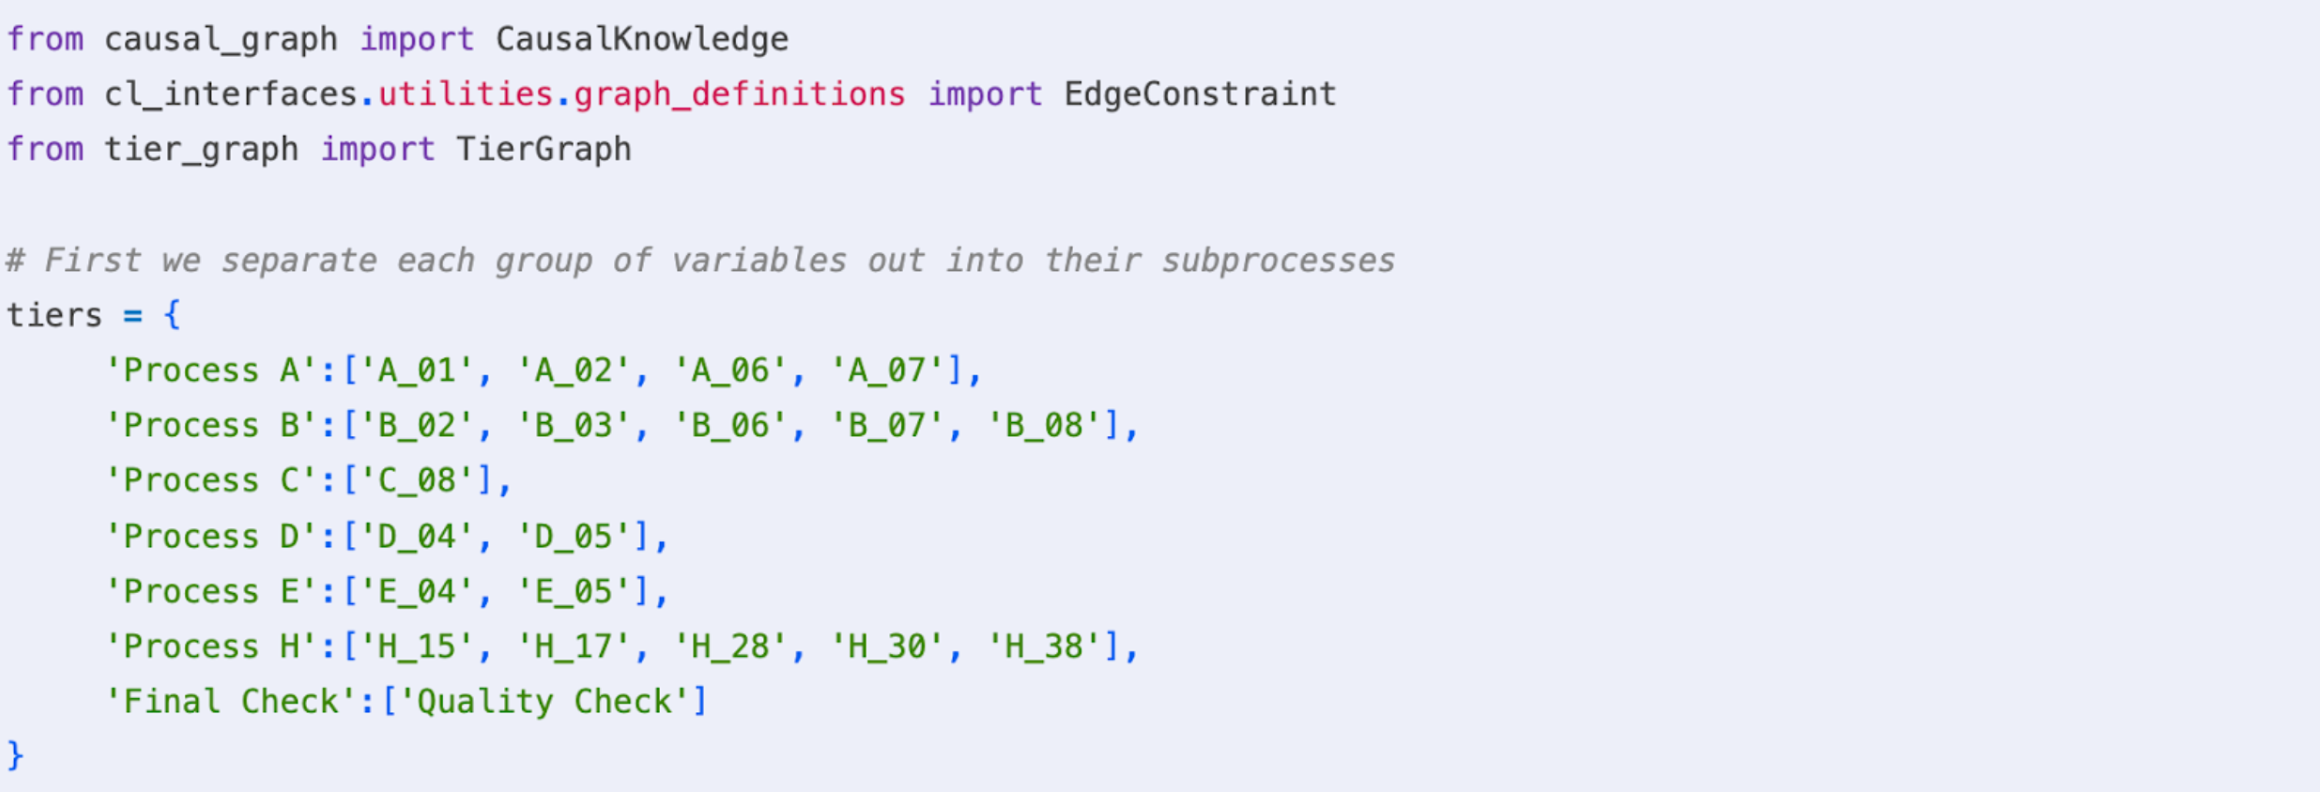
Figure 5: Encoding knowledge of the physical system
Next the interactions between groups within the hierarchy needs to be defined. This can be done using code or graphically if a domain expert is encoding the relationships. The graphical approach is shown in Figure 6.
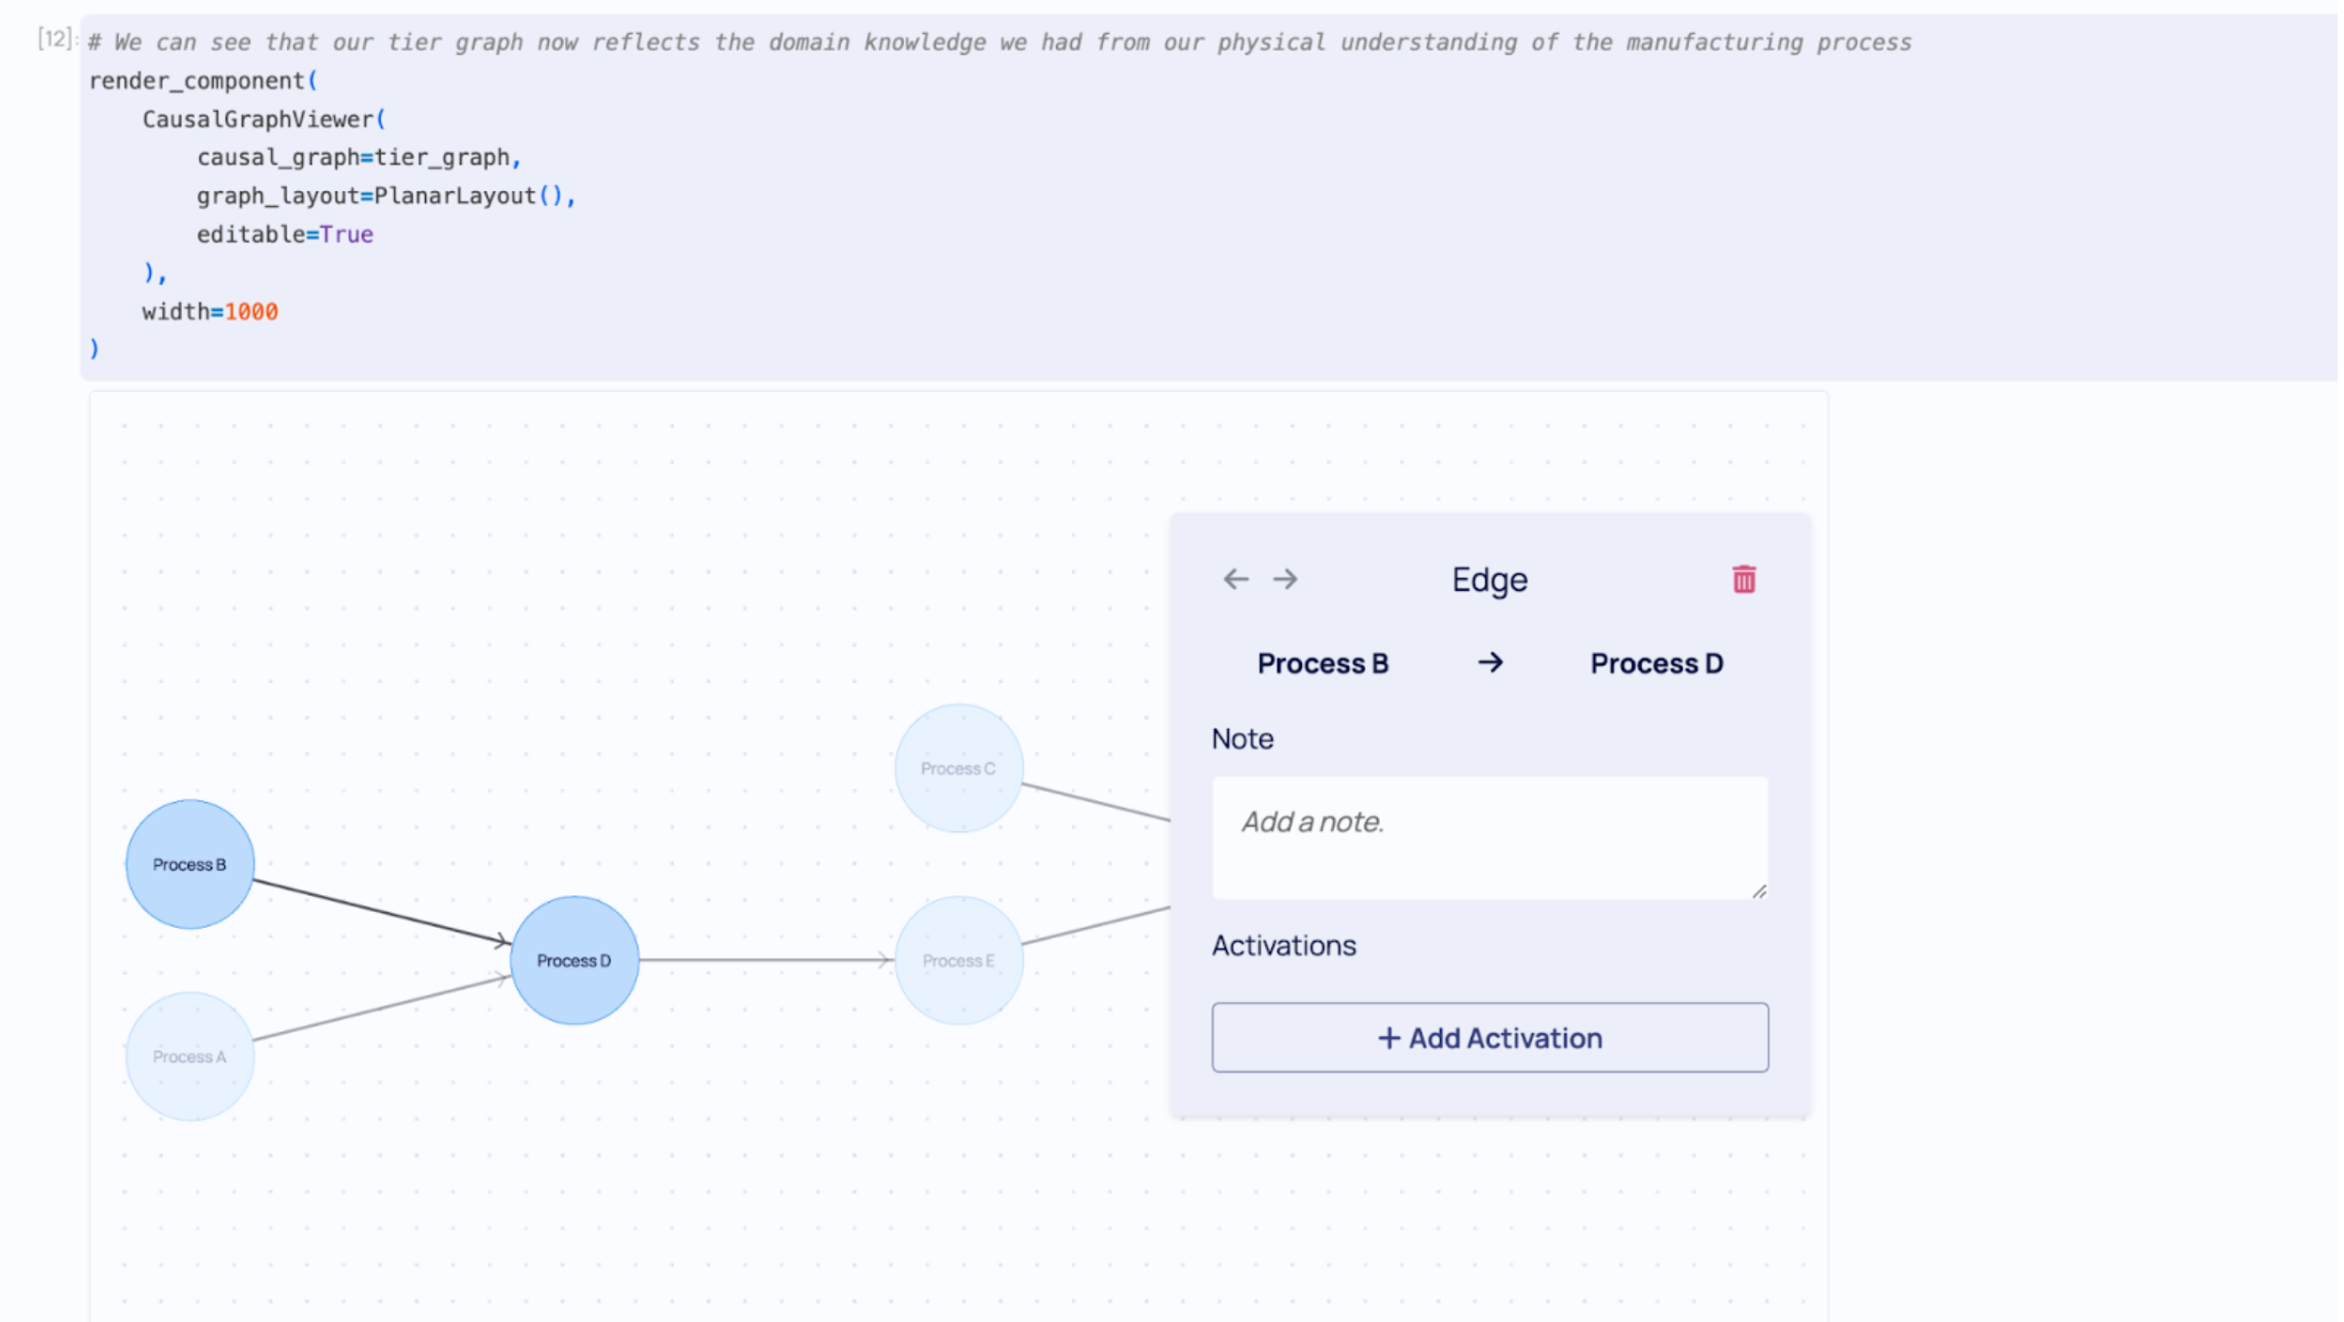
Figure 6: Graphically describing relationships between parts of the physical system
It is also known that the Quality Check score is a function of the measurements in Process H so this information can also be specified through edge constraints (Figure 7).
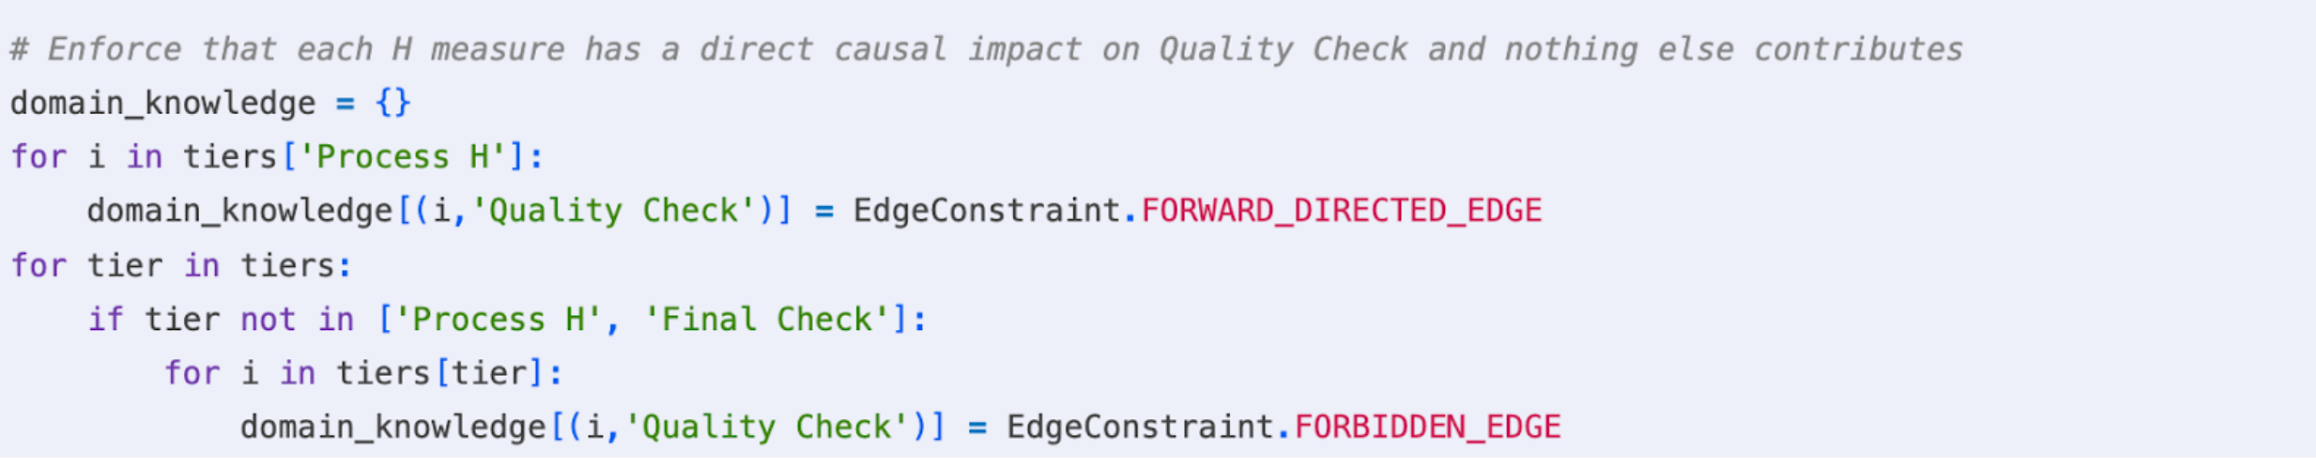
Figure 7: Encoding Quality Check score as a function of the measurements in Process H
Finally, the domain knowledge needs to be passed to the causal discovery algorithm. It can now be seen that the tier graph reflects the physical reality of the manufacturing process. This is shown in Figure 8.
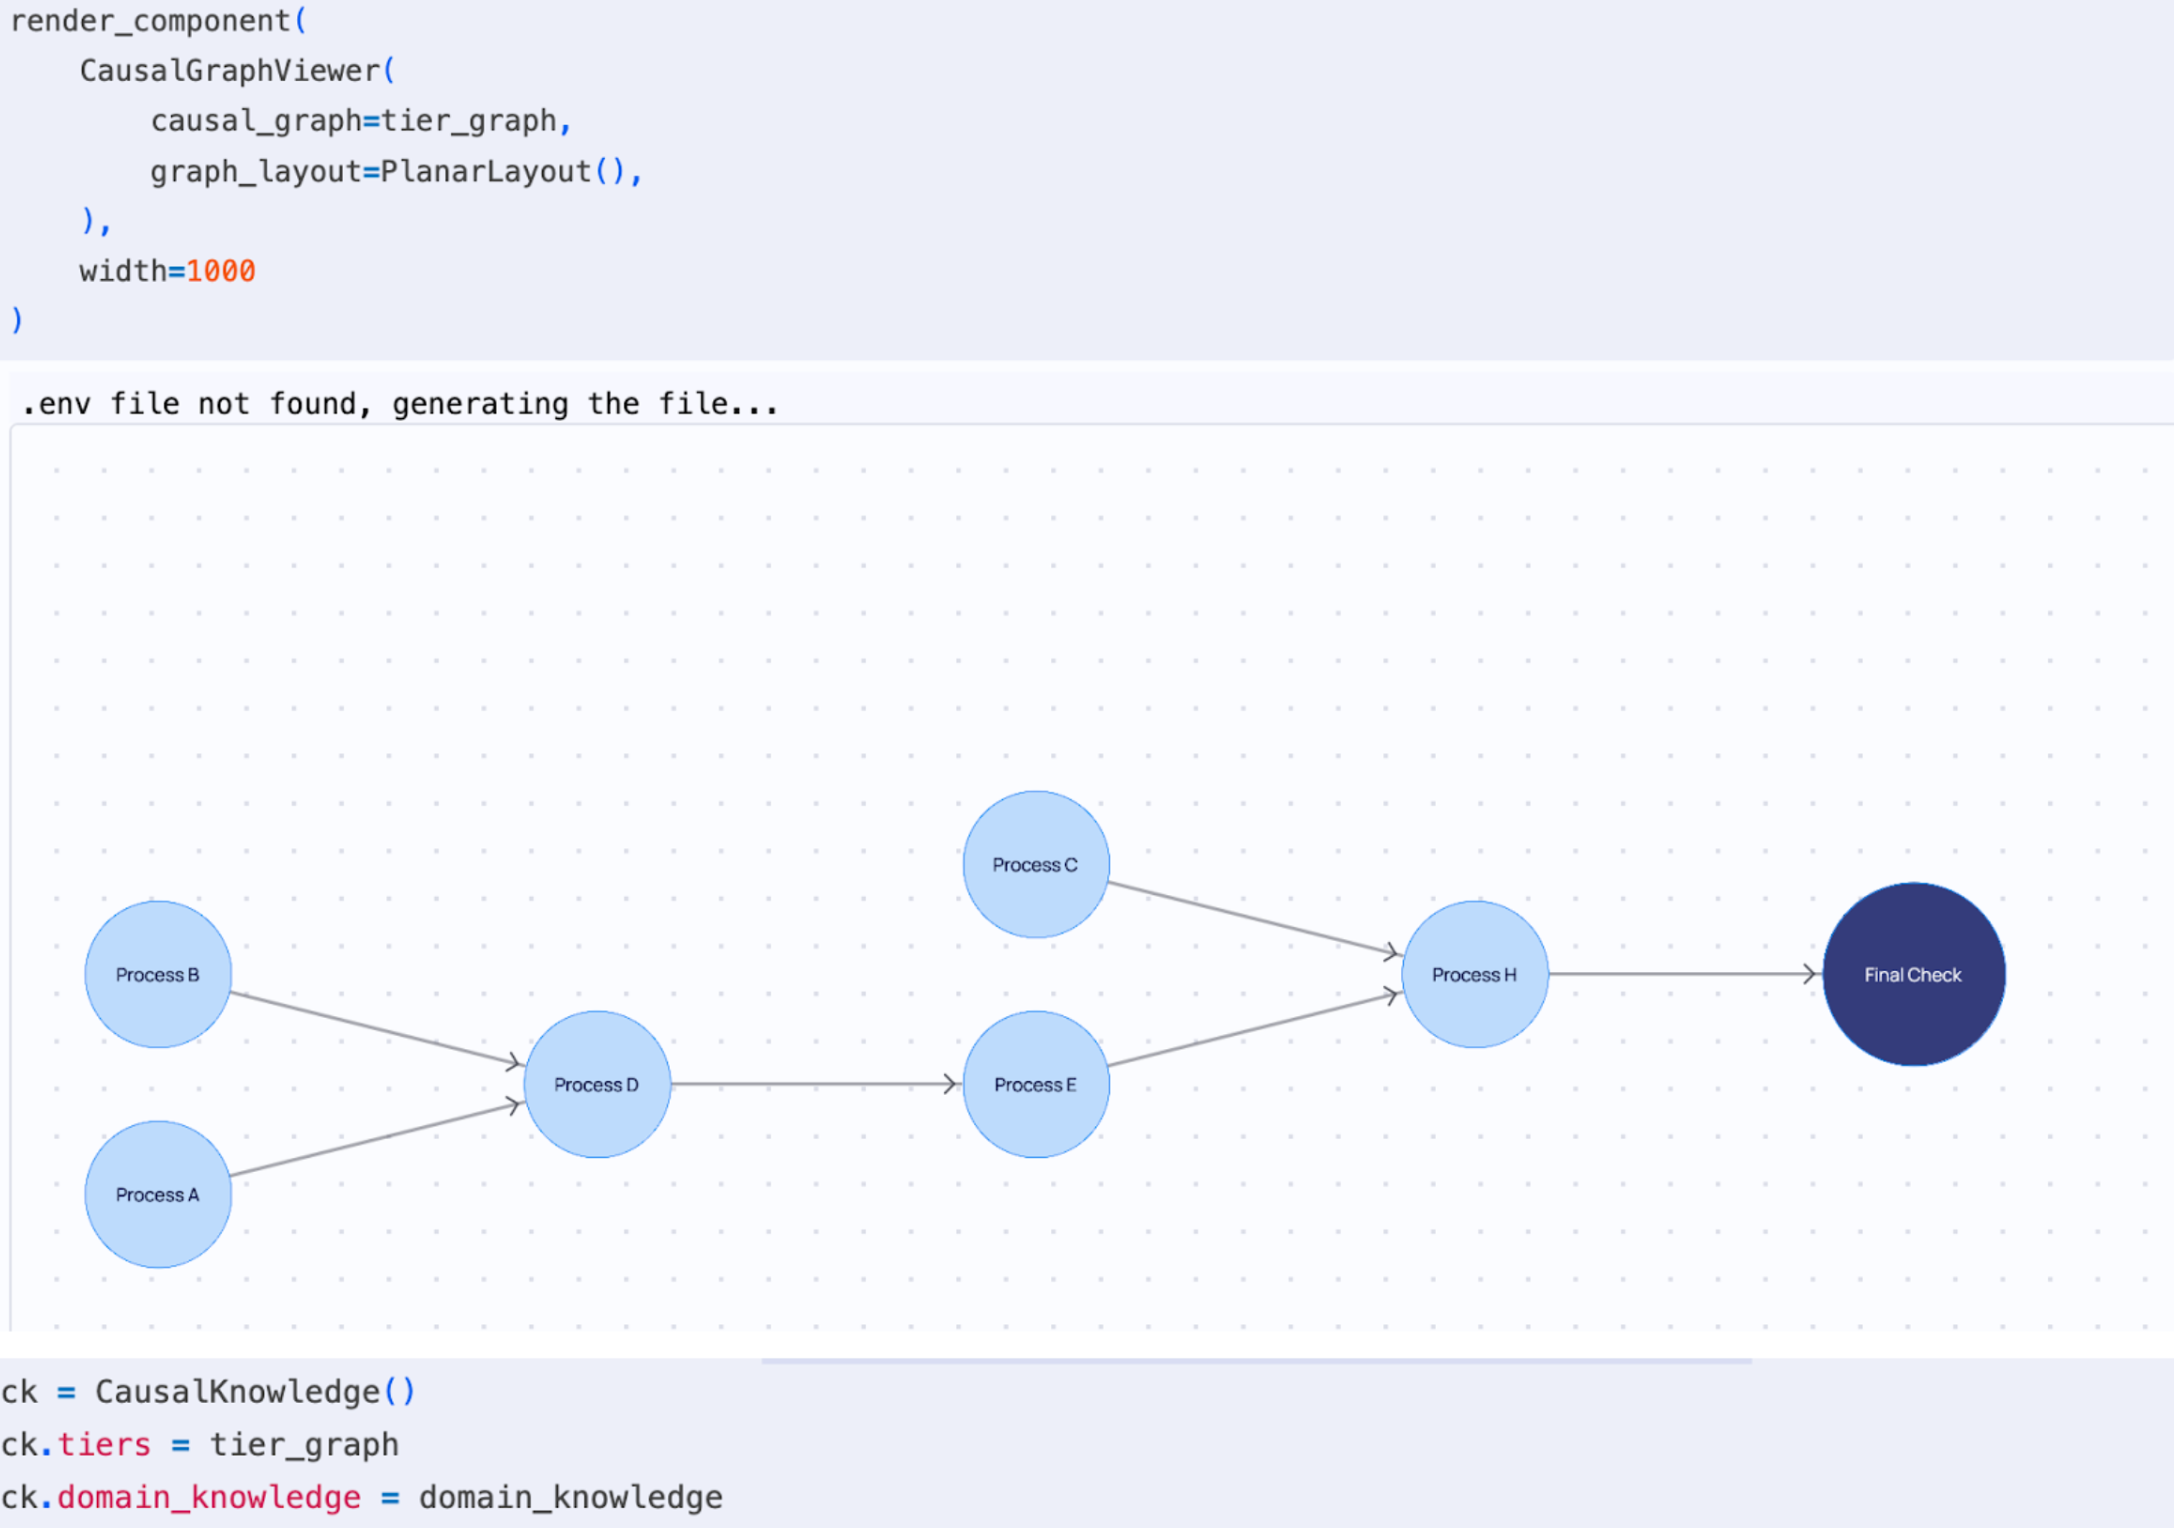
Figure 8: Manufacturing system representation within decisionOS
Now that the domain expertise has been included, algorithmic causal discovery is used to learn causal relationships across each of the sub-nodes within the overall manufacturing process. This process works by looking for natural experiments in the data, while respecting the constraints provided by domain-experts, to gain a full understanding of the cause and effect relationships within the system. In this case, the FCI Tiers algorithm, which is included within decisionOS, has been used to discover the full causal graph (See Figure 9). decisionOS contains a range of causal discovery algorithms which can be used for different use cases and data types.
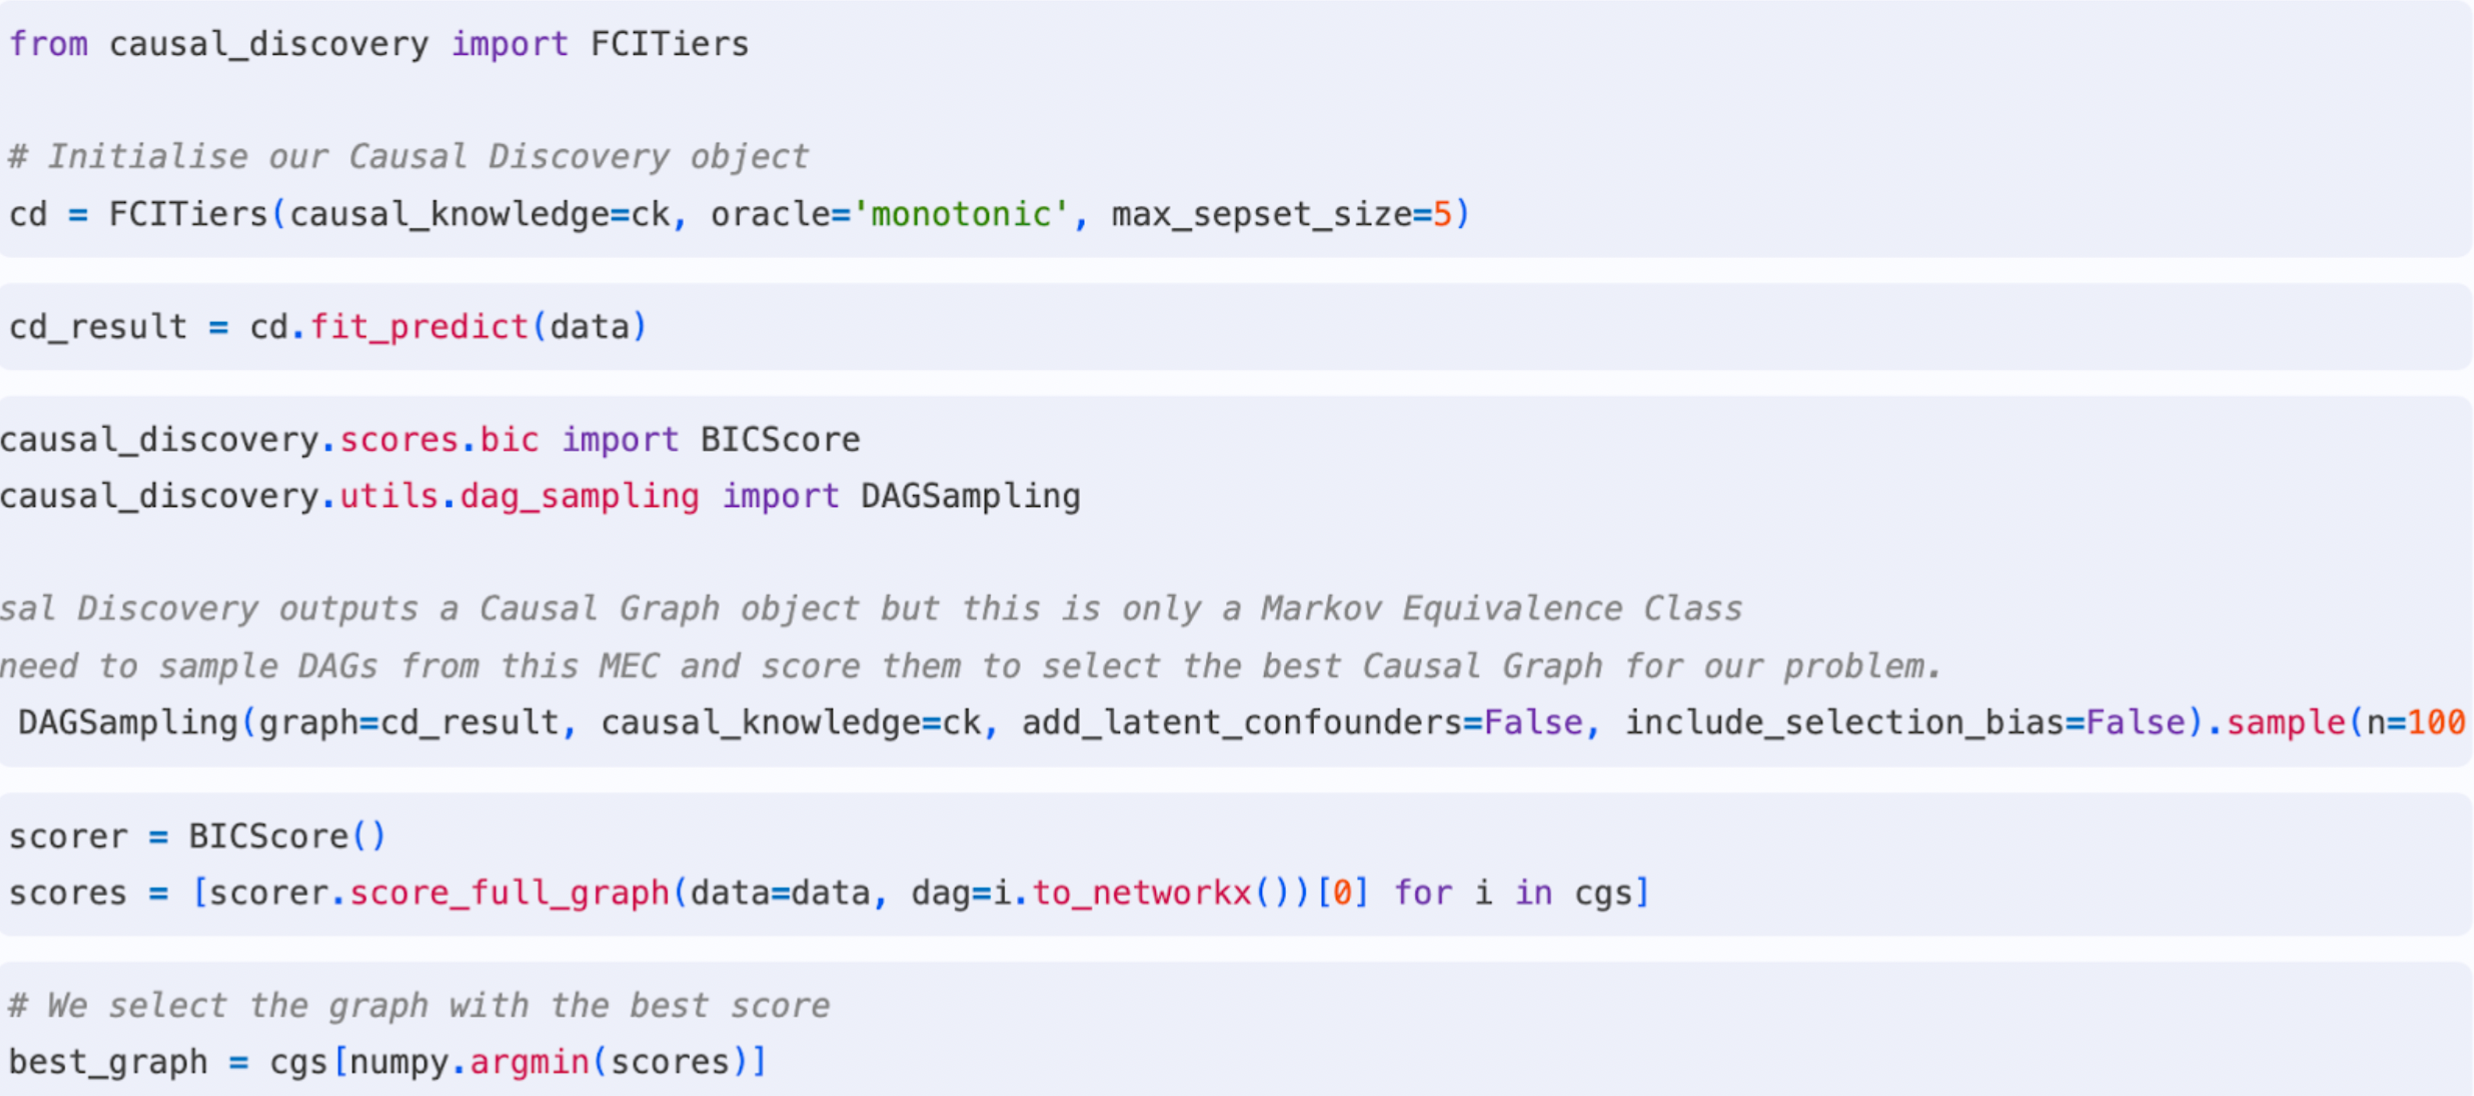
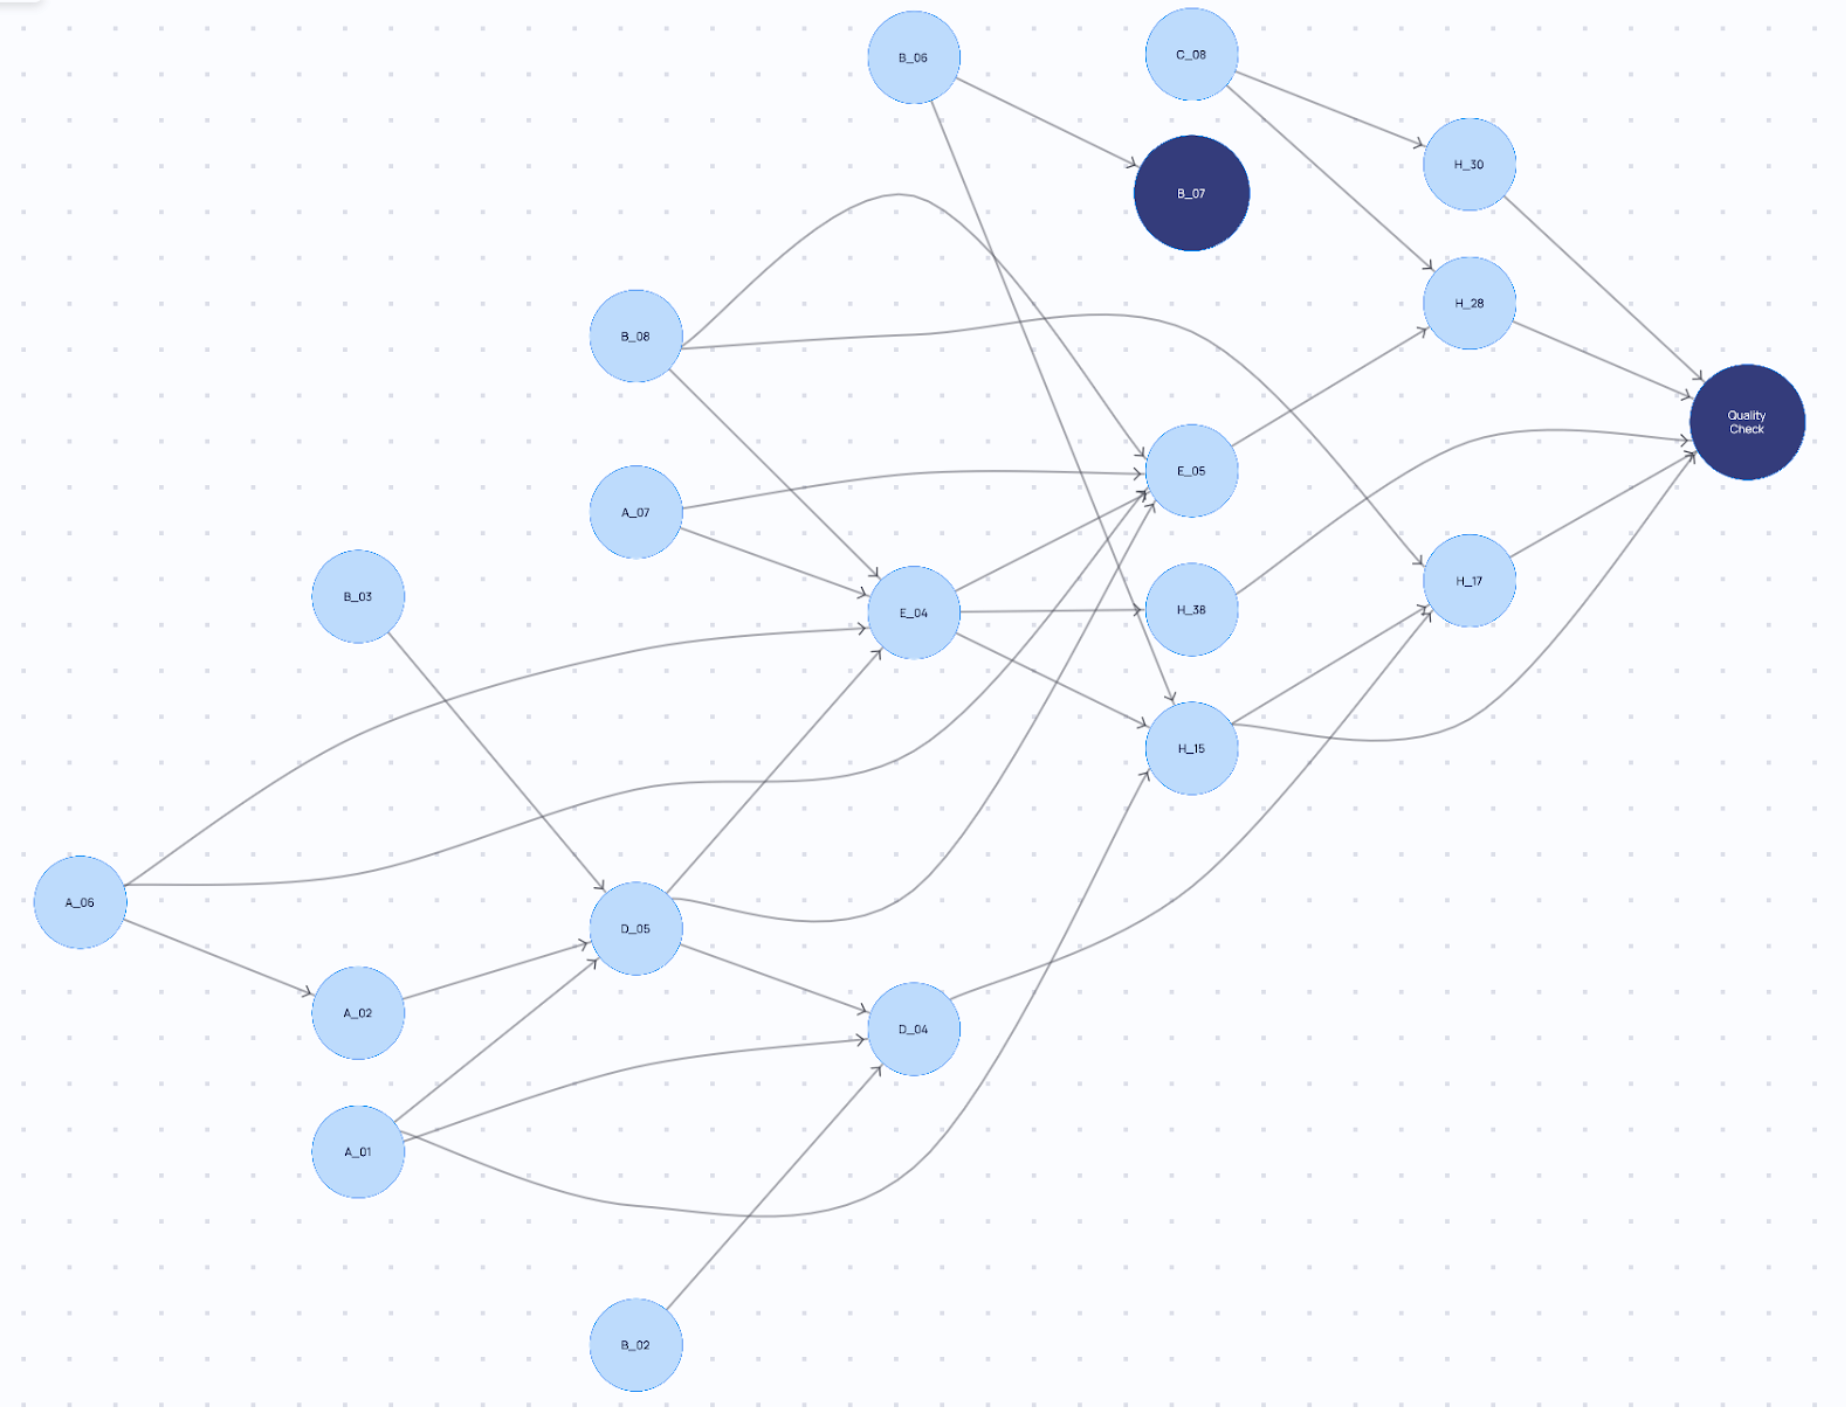
Figure 9: Use of algorithmic causal discovery to augment the expert-provided domain-knowledge
Now that the Causal Graph describing the data has been discovered, a Structural Causal Model is required. The Structural Causal Model outlines the functional relationships between different nodes within the graph. causaLens’ proprietary framework ‘CausalNet’ will be used to automatically discover the structural causal model (See Figure 10)
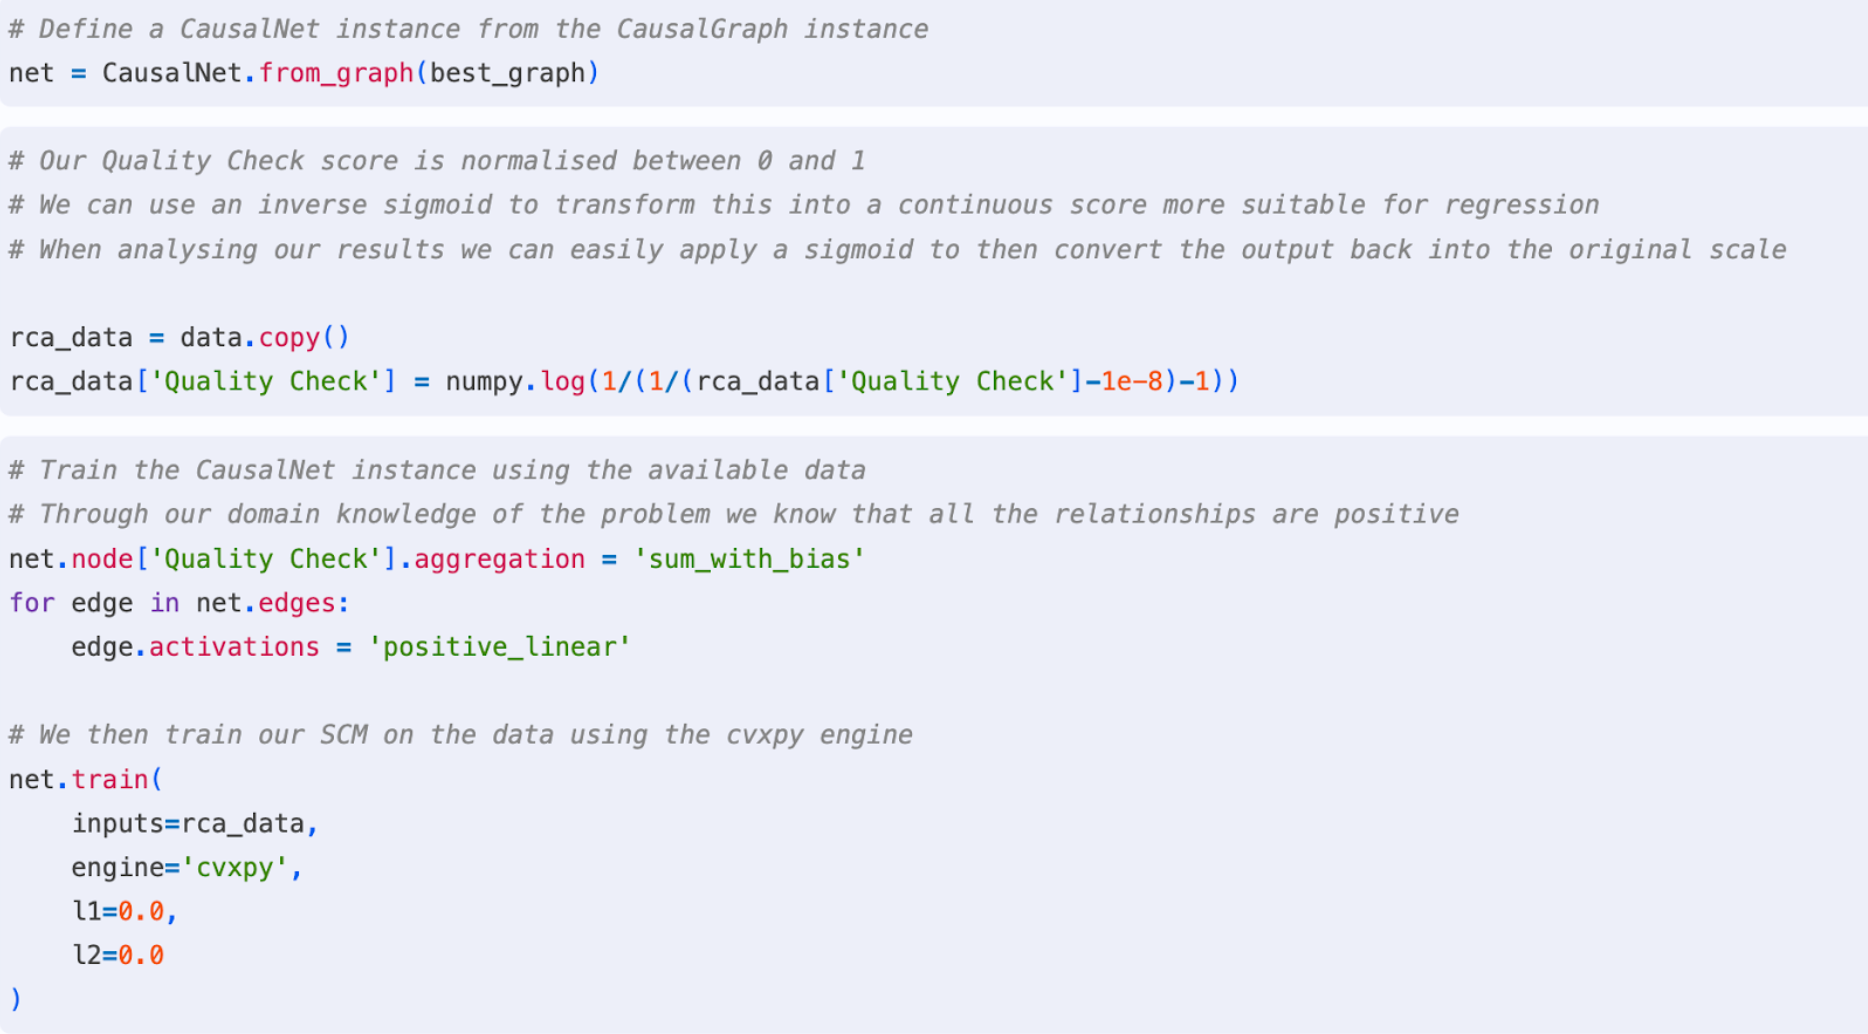
Figure 10: Structural Causal Model discovery
Once the causal model has been created, causaLens’ Explainable AI component can be used to provide a graphical view of the functional relationships, allowing them to be inspected. This view can be rendered within Jupyter notebooks using decisionOS.
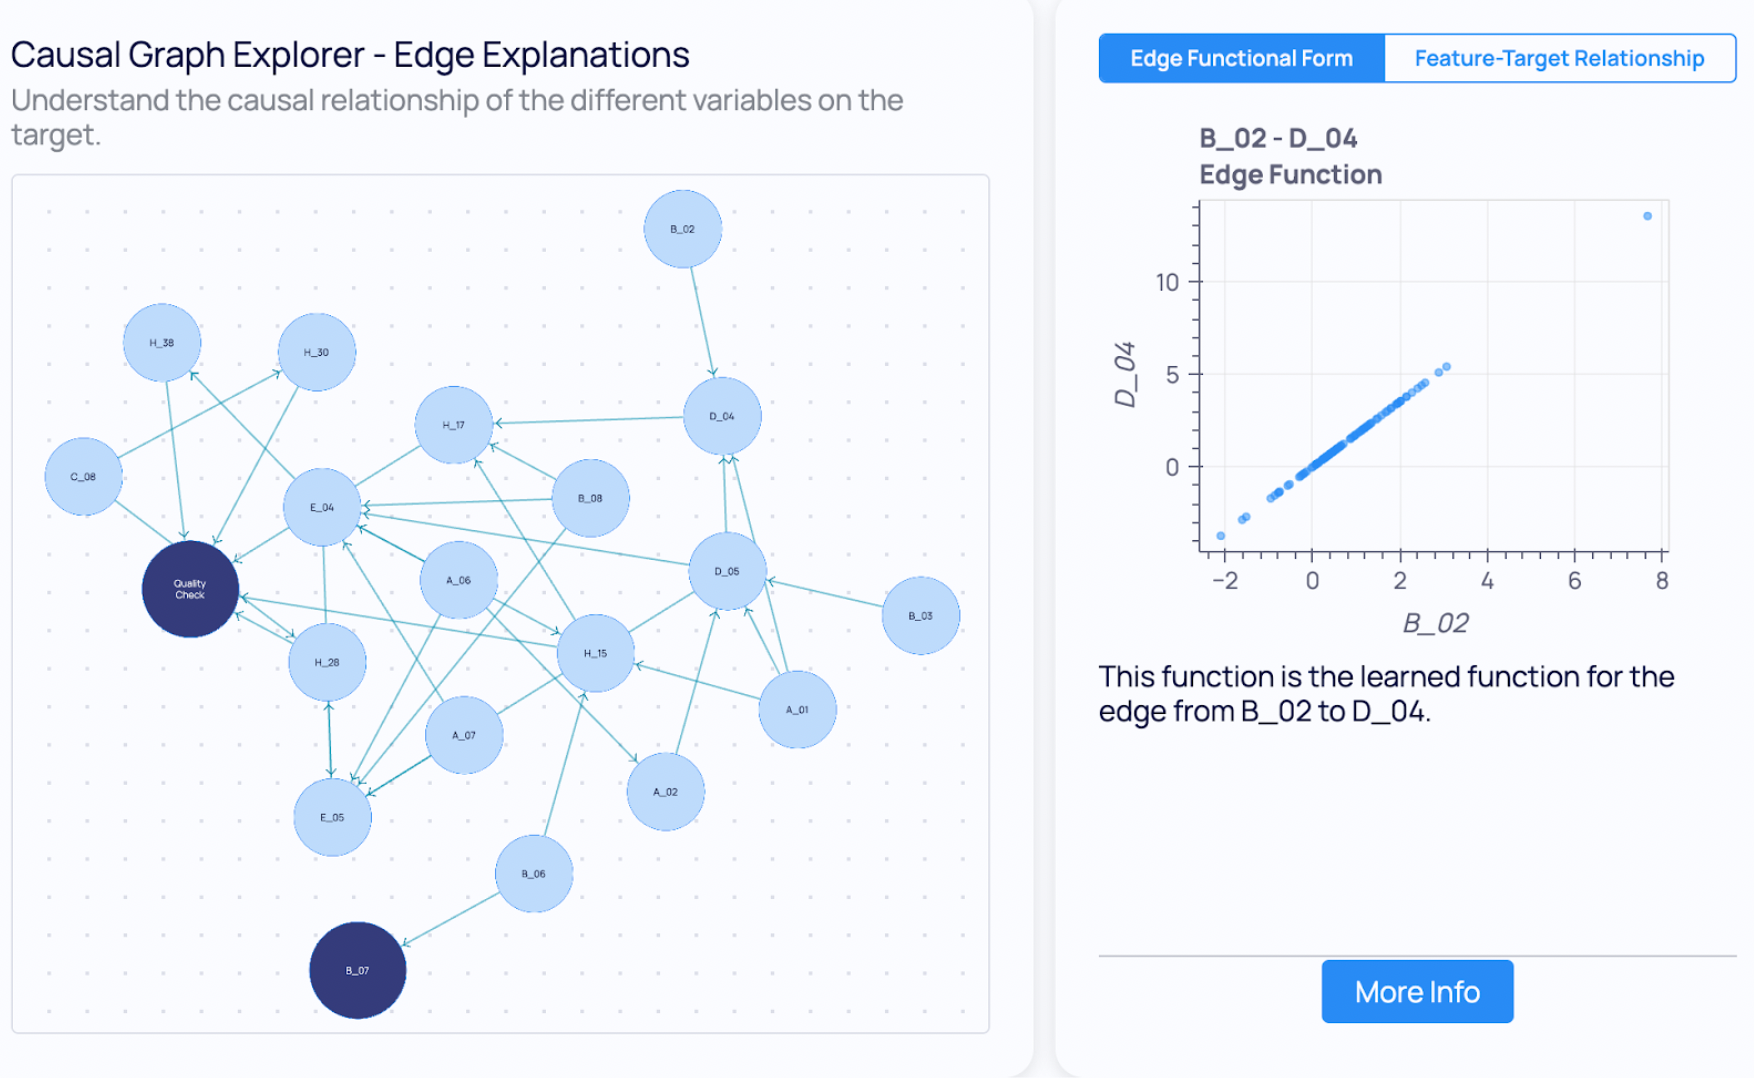
Figure 11: Inspecting edge relationships using causaLens’ explainable AI component
Now that the structural causal model is complete, the next step is to use causaLens RCA decision intelligence engine to understand the root cause of real issues within the manufacturing process.
Root-Cause Analysis (RCA)
There are two possible approaches to RCA: InterventionalRCA with exogenous Noise and CounterfactualRCA. Both methods attempt to identify root causes by finding out which variable, when set to a control value, changes an unfavourable outcome to a favorable one. The methods differ in how they leverage information during root-cause analysis, specifically:
InterventionalRCA does not include an estimate of the underlying noise. Data Scientists can estimate the underlying noise and then modify the causal graph to capture the noise terms. This allows InterventionalRCA to identify intermediate nodes as the root causes of issues.
CounterfactualRCA uses the observations of the unfavourable target outcome to estimate the underlying noise in the data. This often yields more accurate predictions of the target variable. However, CounterfactualRCA also requires the scores of nodes on the same causal path to be disentangled. This can be done using a rule-based approach and an empirical similarity distance measure. InterventionalRCA does not require disentangling as the exogenous noise terms are independent of other variables on the causal path.
The following section will deepdive into CounterfactualRCA as this is the approach which is most commonly used.
RCA deepdive
The faulty parts of the dataset have already been identified in the anomaly detection section of the workflow, this part of the workflow aims to establish root causes.
First, a single event is analyzed and then RCA is performed for all outlier events to get an aggregate root-cause measure. See Figure 12.
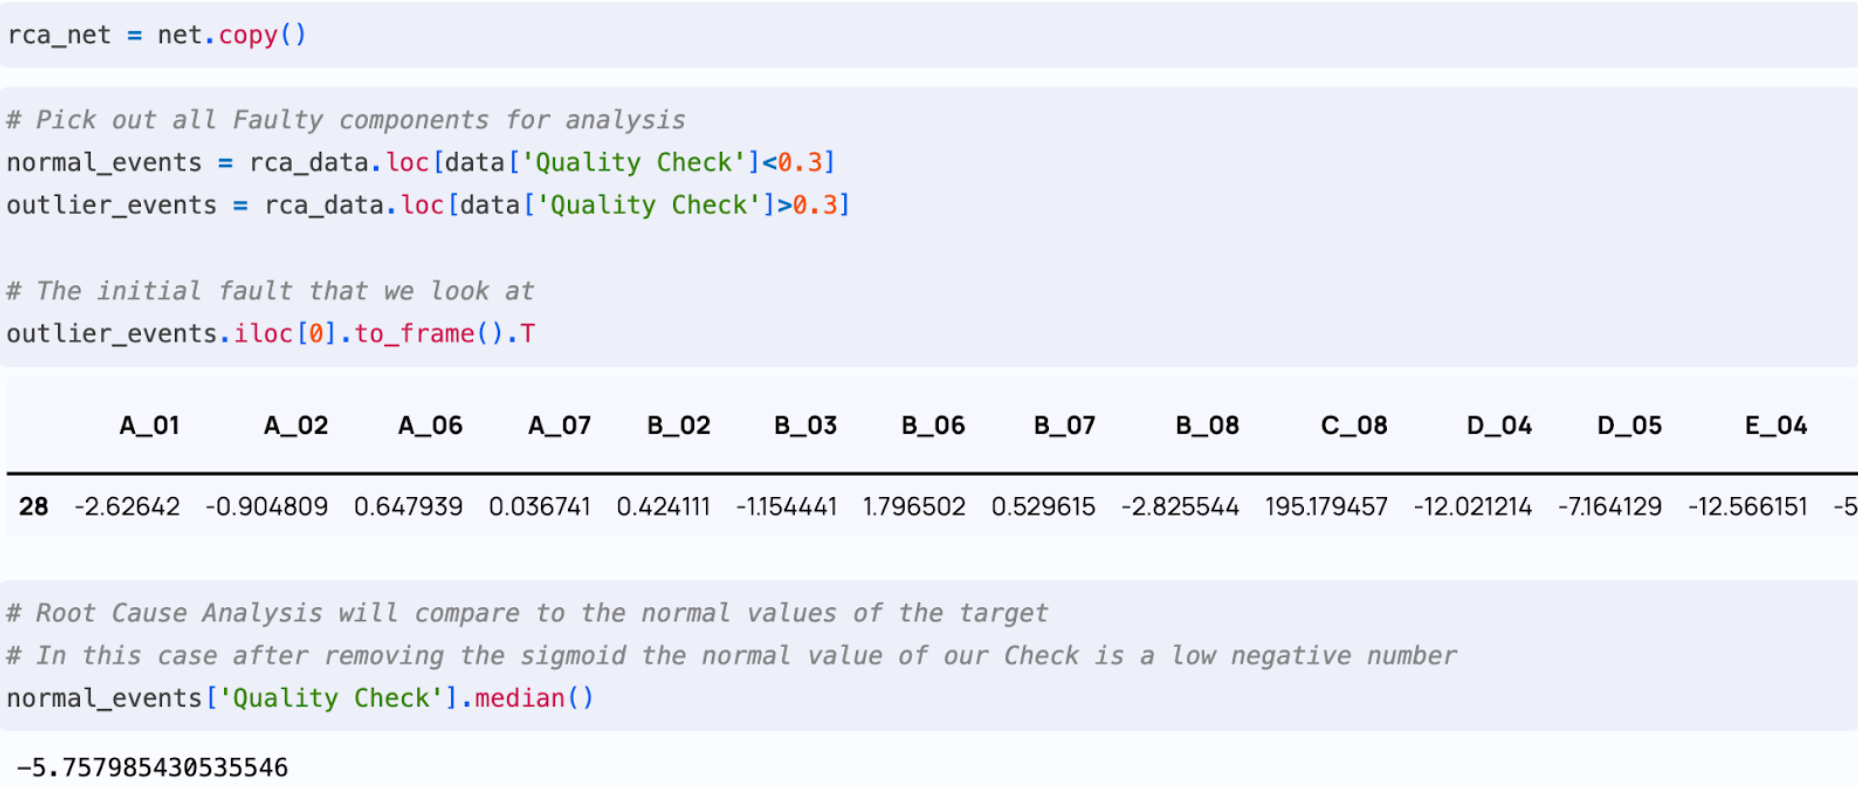
Figure 12: Obtaining an aggregate root cause measure
CounterfactualRCA deep dive
In CounterfactualRCA, a `CounterfactualRCA` object is instantiated using the trained causal model, i.e. `CausalNet` instance.
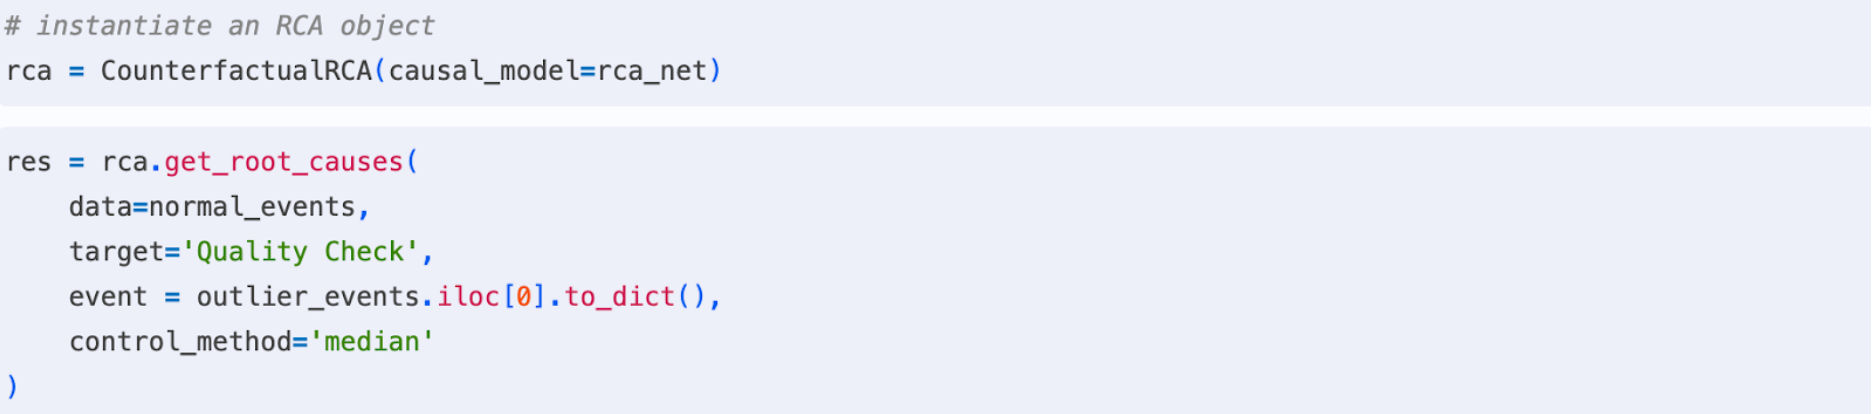
Figure 13: Creating a CounterfactualRCA instance
Following this, a ranked list of top root causes can be obtained via the RCAResult.ranking field. Figure 14 shows that H_28 has been identified as the top root cause with C_08 the next most impactful. By observing the causal graph, it can be seen that C_08 drives H_28 and H_30 so it is possible that it is the true root cause. However, since all of these nodes are on the same path, it is important to disentangle the impact of the nodes themselves from the impact of their parents and children. We can control this in CounterfactualRCA through the similarity_distance parameter. The code shows how the scores for each node, as well as their score in original scale back through the sigmoid, can be generated. This shows that C-08 is indeed the true root cause.
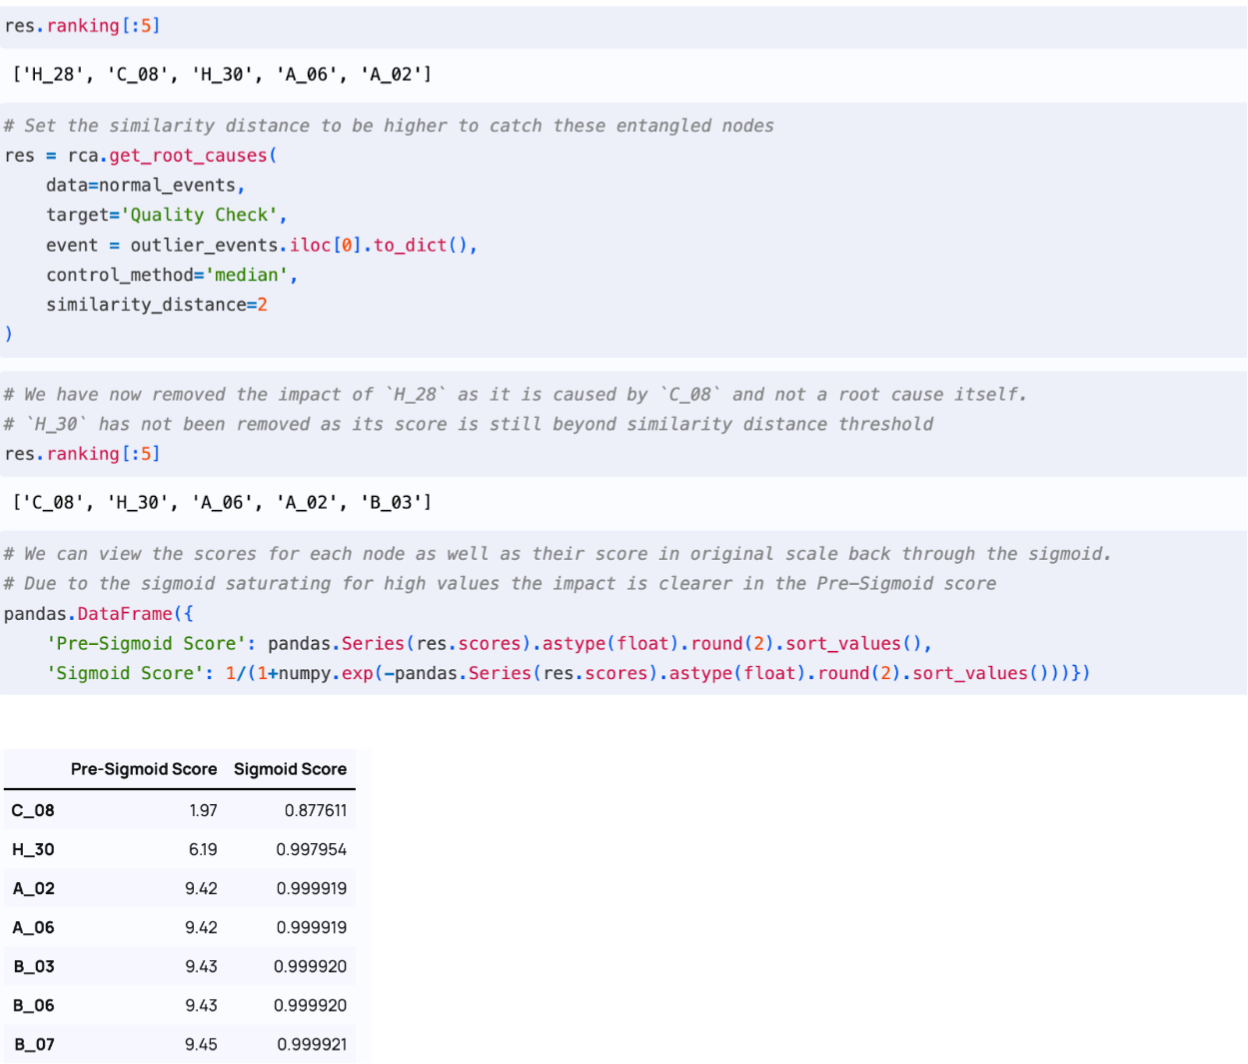
Figure 14: Identifying true root causes based on similarity distance parameter
The CounterfactualRCA approach can now be applied to each of the identified faults to discover the root cause. With decisionOS this type of analysis can be applied in real-time, to quickly uncover why faults are creeping into the manufacturing process, so that they can be resolved in a timely manner. Manufacturers use decisionOS as part of their workflows to quickly isolate
and correct these issues.
decisionOS seamlessly facilitates the creation of decision workflows
for manufacturing Root Cause Analysis. Using Causal AI, it is possible
to use interventional and counterfactual RCA to isolate the root
cause of manufacturing issues including where there are multiple
causes and the contribution of each cause needs to be understood.
Organizations that use Causal AI for manufacturing
RCA see a significant reduction in downtime due to
manufacturing line faults.